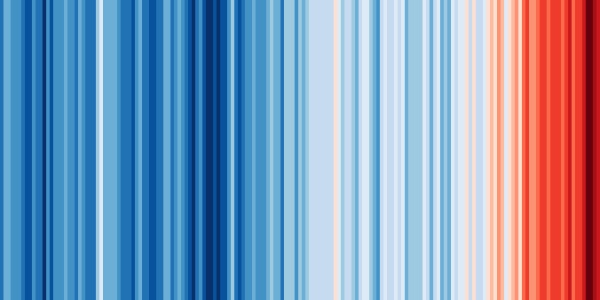
We do really good with visualizations. When we can put abstract ideas, like climate change, into something we can see, people understand it better. As with most things, simple goes a long way. Which is why the Warning Stripes Visualization works so well and now you can see it for your area.
The image is simple. They just colored lines in various shades of blue, orange, and red. Each line represents the yearly average temperature departure for a year. The blues are cooler than normal and the reds/oranges for warmer. That’s it. You can clearly see that things have gotten much warmer in the last few years.
The new website allows you to view this information, in this format, for your local country and even city for some locations. Yours might be a bit different than the global average but it will probably still be more red than any of us would like.


